Bunnings Voucher Appraisal Competition
Our winners of the Bunnings Vouchers are as follows: 1. $1,500 – George Riganas 2. $1,000 – Gholam Ali 3. $500 – Mitchell Popovic

Land tax, lawn mowing and legal fees sit among the lengthy list issued by the ATO of landlord rental expense claims.
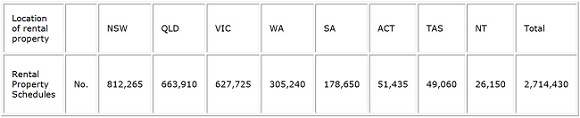
Australia’s 1,895,775 property investors own 2.71 million rental investment properties, according to the latest figures from the ATO.
NSW leads with 812,000 properties, followed next by Queensland and Victoria.
The statistics for the 2011–12 income year show the extent of rental property expense claims on the properties.
Some 2 million plus properties were subject to claims by landlords for interest on loans, averaging an $11,500 claim.
The data shows council rates is the most claimed expense with 2.51 million claims from the 2.71 million rental property pool. The typical council rates were $937 a year.
Water charges averaged $530 a year, the second most utilised expense with 2.17 million properties.
The lowest number of landlord claims on the 19 expenses check list was for lawyers which was utilised by 69,590 properties at a $620 average expense. Pest control was also not that utilised, in second last place, with a typical $210 average cost.
Some 582,000 properties – 21% – were hit by land tax with the average expense being $1,270 a year.
Some 12% of tenancies were requiring advertising for new tenants at a typical cost of $230.
The highly scrutinised travel expense refund was claimed for 804,000 properties – around 30% of properties – with a typical $480 travel claim.
(Claim type no of properties $ total landlord claims)
| Council Rates | 2,517,370 | $2,360,548,979 |
| Water charges | 2,170,135 | $1,155,573,028 |
| Interest on loan(s) | 2,087,570 | $24,102,668,712 |
| Insurance | 2,086,740 | $1,062,276,520 |
| Repairs and maintenance | 2,020,540 | $2,073,635,655 |
| Property Agent fees/commission | 1,855,500 | $2,098,084,871 |
| Plant depreciation | 1,780,500 | $2,028,038,155 |
| Sundry rental expenses | 1,489,575 | $894,509,695 |
| Capital works deduction | 1,054,175 | $2,139,156,047 |
| Stationary, telephone and postage | 935,455 | $59,486,951 |
| Body Corporate Fees | 852,805 | $1,667,073,259 |
| Travel expenses | 804,925 | $388,233,963 |
| Borrowing Expenses | 585,395 | $242,502,146 |
| Land tax | 582,300 | $739,311,332 |
| Gardening/lawn mowing | 409,145 | $165,738,793 |
| Cleaning Expenses | 342,015 | $192,405,834 |
| Advertising for Tenants | 331,470 | $76,681,158 |
| Pest Control | 269,325 | $57,307,475 |
| Legal Fees | 69,590 | $43,177,549 |
| Total Net rental income | 2,696,785 | -$8,034,540,412 |
Source: © 2014 PROPERTY OBSERVER P/L
Our winners of the Bunnings Vouchers are as follows: 1. $1,500 – George Riganas 2. $1,000 – Gholam Ali 3. $500 – Mitchell Popovic
Melbourne and Darwin’s housing markets are finally heating up after sitting out the boom, with Darwin prices jumping 11 per cent and Melbourne hitting a new all-time high. Two of Australia’s quieter housing markets are now showing clear signs of recovery. Melbourne and Darwin, both late to join the upswing, … Read more